
Mite Maths
9 min readAndrew Wootton
Here in Victoria, it’s the calm before the (varroa) storm. The Victorian heat map of July shows three detection clusters, the incursion is well-seeded. And almond pollination will inevitably be a super-spreader event. I’m assuming I will have mites in my hive sometime in the next 12 months.
“Nine to five” is the mnemonic for mite wash thresholds, easily recalled thanks to Dolly Parton. But let’s dig deeper into what these numbers signal. If during spring, autumn or winter our sample of 300 bees contains 5 mites, we should consider how many mites this represents in the colony. Five mites per 300 is 1.6%. Let’s estimate a population of 30,000 bees (not unreasonable[1]), but the mites will be concentrated on the nurse bees, corresponding to 250 mites on 15,000 nurse bees. Remember though, that in a hive that is actively raising brood, 2/3 of the mites will be in the reproductive phase under the brood cappings, meaning there are likely to be at least 750 mites in the hive. Similarly, a mite wash count of 9 during summer denotes 1350 mites in the hive – which is starting to get scary! And don’t forget those reproductive mites will soon emerge with their daughters.
We know that once mite numbers exceed several thousand, the colony will collapse and die. How much damage do these intermediate numbers of mites cause? This is harder to determine due to the variable impact of viruses.[2] And Australia is unusual in that we don’t have deformed wing virus in our European honey bee population (keep those fingers crossed).
One way of deciding when to treat is the economic threshold. This is chosen to keep numbers below the economic injury level, which is the pest number at which treatment cost balances against losses. Researchers Cameron Jack and Jamie Ellis[3]reviewed the literature on economic thresholds and suggest 2-5% was the level for treatment, but report a lack of data. Since then, data from Canada[4] suggests that <1% in autumn may reduce colony loss. Monitoring weight gain in hives in France[5],[6] showed 3% to be the threshold above which colony performance weakened. Of note is the likelihood that high immigration during the early acute phase of the incursion may allow higher economic thresholds and economic injury levels due to mite impact being focused on adult bees rather than pupae.[7]
All of which suggests that the recommendation from Australia’s National Varroa Mite Management Plan to use treatment thresholds of 5 and 9 is very reasonable. But I’d like to challenge the thinking behind this. The concepts of integrated pest management and economic threshold have been handed down from agriculture in general. They are appropriate if you are growing cabbages. Spray with a pesticide and get more cabbages to sell. Balance the cost with the increased yield. But we are dealing with bees. We are interested not only in a harvest, but the year-to-year survival of our colonies. The more relevant metric is the number of treatments per year.
Randy Oliver has built and made available a model of mite population growth.[8] It allows variable inputs for climate, colony size and mite immigration. Mite numbers are calculated throughout the year and treatments at various levels of efficacy can be applied. I’ve run extensive tests using the model, selecting the option for high mite immigration due to feral colony collapse – what we have in Australia now. Here are the results.
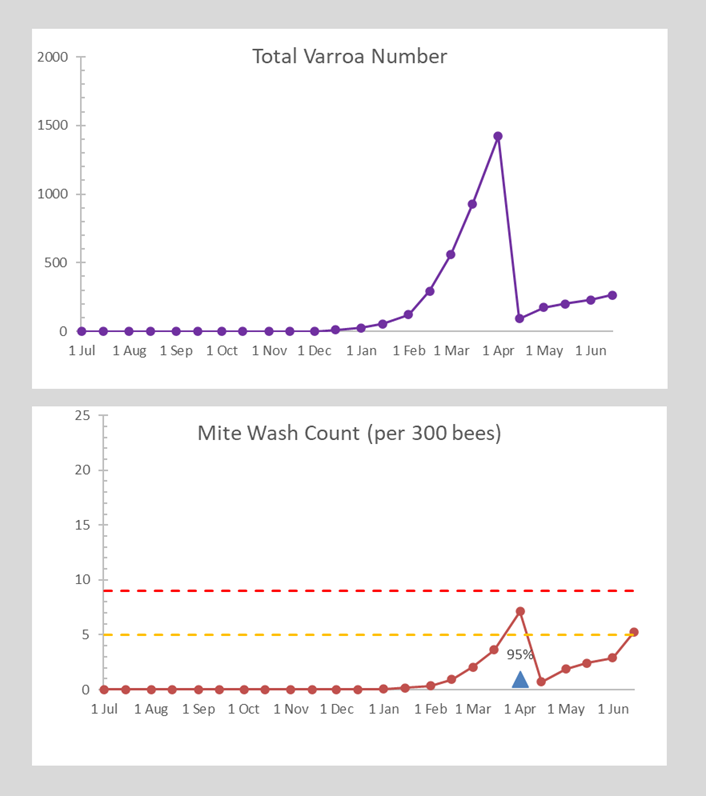
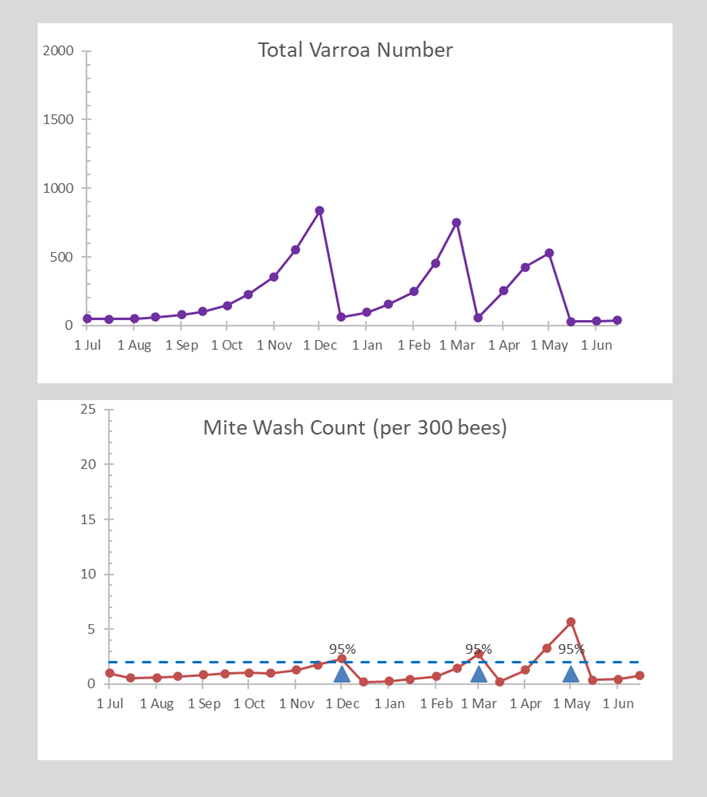
The first graphs (fig 1) show what happens over a year with no mites at the start of the season. Due to immigration, we hit the treatment threshold in April. I’ve utilized a treatment with 95% efficacy (e.g. a synthetic strip such as Apistan or Apivar, see note) and this has reduced the mites. However, the residual winter mite load is over 200.
Fig 1.
Now let’s look at the following year, starting with this initial mite load of 200 (fig 2). Here, we have to treat in December (>9), March and May (note the different scale for the total mite numbers). Again, I’ve used the most highly effective treatments (and I have, of course, remembered to rotate between these to avoid resistance).
Fig 2.
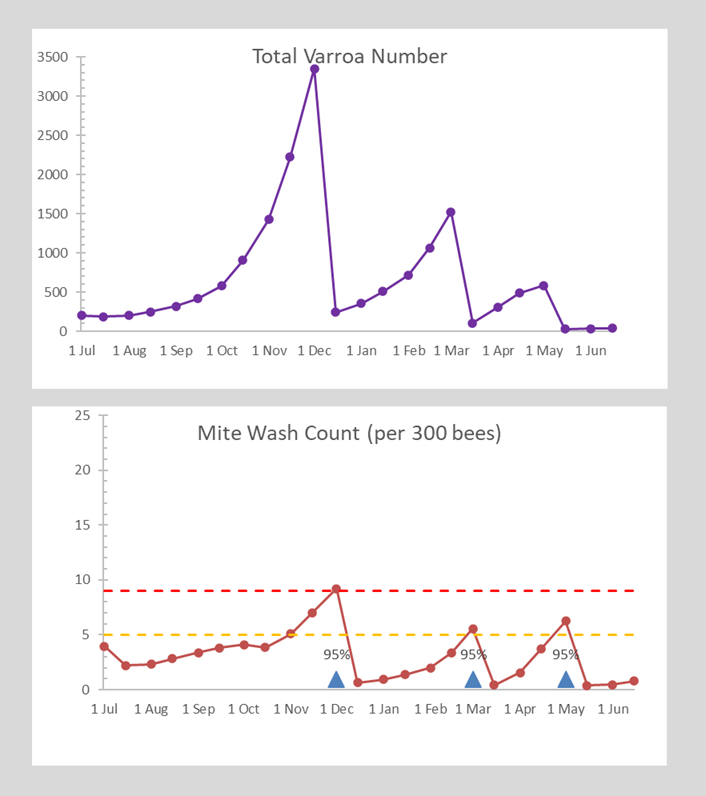
I’ve done well, ending the year with less than 50 mites. But mite numbers climbed very high, to levels that will significantly impact the bees.
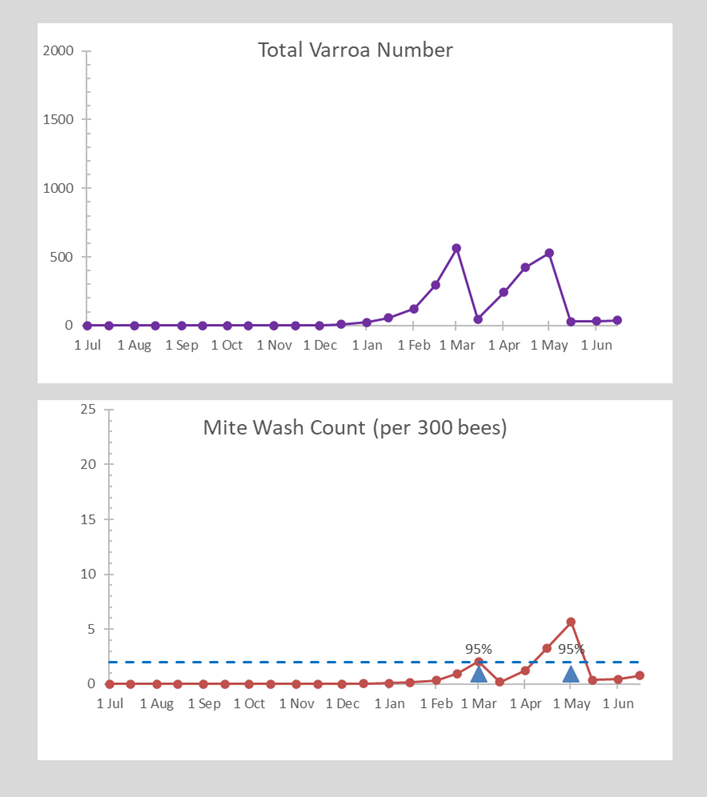
What if I use the lower treatment threshold of two mites in a wash? This time I needed to treat in March and repeated in May. It did require an extra treatment, but my mite load in winter was less than 50 (fig 3).
Fig 3.
And the following year, starting with 50 mites, I still needed 3 treatments (fig 4), but kept my mite numbers below 1000, ending with less than 50 mites.
Fig 4.
Over the course of two years, using the higher threshold required four treatments, compared to five at the threshold of two. So, the economic argument for the “official” thresholds of 5 and 9 probably stands up (just), but with the disadvantage of hosting much higher mite numbers.
But let us consider a few other scenarios. If we compare starting mite loads of 200, we end up requiring 3 treatments per year whether we use a threshold of 2 or 5. Try as I might (pun intended) I can’t simulate using less than 3 treatments per year during the initial phase of the epidemic. My conclusion from this modelling, is that waiting for mite counts to reach 5 (or worse still 9) is simply delaying the inevitable. Cameron Jack pointed out at the recent VAA conference that the more mites you have reproducing, the more opportunities there are for resistance mutations to occur. Not to mention the damage to the bees and reduction in honey gathered.6 During these next few years, it seems to me prudent to treat as soon as mites appear. This is consistent with the NSW experience.[9] Once everything settles down with less mite immigration from collapsing colonies, it will become less fraught and we may be able to transition to less frequent and more organic treatments.
Like the old election saw, “vote early, vote often”, treat early, treat often. I’m certainly going to.
Note on Efficacy
| Miticide | Registrant reported efficacy |
| Apivar | up to 95% |
| Apistan | 95-99% |
| Apiguard | 74-95% |
| Formic Pro | 83-97% |
| Api-Bioxal | 82-99% (when brood absent) |
Miticide treatments vary considerably in their efficacy, due mainly to whether mites in the reproductive phase (under the brood cappings) are affected. A flash treatment with oxalic acid will impact only the phoretic mites and so only kills about 30% of the mites in a hive when brood is present. On the other hand formic acid is more effective (~85%) as it also targets mites in brood. Synthetic miticide strips are particularly effective (~95%) as they remain in place for 6-10 weeks, thus killing mites as they emerge from the brood. Combining treatments with a brood break will greatly enhance efficacy. The table is derived from the Honey Bee Health Coalition’s Tools for Varroa Management (https://honeybeehealthcoalition.org/). Note the figures for the synthetic chemicals assume no mite resistance (which has developed widely overseas).
Thanks to Kris Fricke and Tony Wilsmore for helpful suggestions in the preparation of this article.
This article is also published in the Australasian BeeKeeper.
Andrew Wootton is Vice President of the VAA and a certified master beekeeper with the Eastern Apicultural Society of N America. He first started beekeeping in the 1960s.
[1] https://theapiarist.org/the-size-of-a-hive/
[2] Martin, Stephen, Ann Hogarth, John Van Breda, and Juilan Perrett. “A scientific note on Varroa jacobsoni Oudemans and the collapse of Apis mellifera L. colonies in the United Kingdom.” Apidologie 29, no. 4 (1998): 369-370. http://doi.org/10.1051/apido:19980407
[3] Jack, Cameron and James Ellis, Integrated Pest Management Control of Varroa destructor (Acari: Varroidae), the Most Damaging Pest of (Apis mellifera L. (Hymenoptera: Apidae)) Colonies, Journal of Insect Science, Volume 21, Issue 5, September 2021, 6, https://doi.org/10.1093/jisesa/ieab058
[4] Morfin, Nuria, Leonard J. Foster, Ernesto Guzman-Novoa, Paul Van Westendorp, Robert W. Currie, and Heather Higo. “Varroa destructor economic injury levels and pathogens associated with colony losses in Western Canada.” Frontiers in Bee Science 2 (2024): 1355401. https://doi.org/10.3389/frbee.2024.1355401
[5] Dechatre, Hélène, Lucie Michel, Samuel Soubeyrand, Alban Maisonnasse, Pierre Moreau, Yannick Poquet, Maryline Pioz et al. “To treat or not to treat bees? Handy VarLoad: a predictive model for Varroa destructor load.” Pathogens 10, no. 6 (2021): 678. http://doi.org/10.3390/pathogens10060678
[6] Kretzschmar, Andre, and Alban Maisonnasse. “More worker capped brood and honey bees with less Varroa load are simple precursors of colony productivity at beekeepers’ disposal: an extensive longitudinal survey.” Insects 13, no. 5 (2022): 472. https://doi.org/10.3390/insects13050472
[7] Whitehouse, Mary, Fazila Yousuf, James Sainsbury, Juliana Rangel, and Mark Goodwin. “Innovations in Varroa mite management.” Current Opinion in Insect Science (2025): 101343 https://doi.org/10.1016/j.cois.2025.101343
[8] https://scientificbeekeeping.com/randys-varroa-model/
[9] NSW VDO learnings from varroa fieldwork, VAA HiveMeet https://youtube.com/live/bPXcxjvmwGA
Consider becoming B-TRACE certified
Join B-TRACE today and take your business to the next level
When you join B-TRACE you can enjoy the following benefits
✔ Access to the B-TRACE hive management app
✔ Proof of compliance with current industry and regulatory requirements
✔ Certification to high industry standards by independent audit
✔ Access to premium marketing and pricing opportunities with the B-TRACE certification logo and marketing tools
✔ Gain consumer trust with B-TRACE product provenance and product authenticity assurance
✔ Keep up to date with the latest industry trends and standards
✔ Access to B-TRACE social media outlets for business and beekeeping improvement and opportunities
✔ Locally and internationally recognised
✔ Audit hotline for assistance
Pingback: Newsletter – OCTOBER 2025 - B-TRACE Australia